
How Do I: Synthetic Runtime Tests
Synthetic runtime tests are an interesting (and clever) way to test the output and duration of rarely-tested flashlight modes. Read on to see (why? and) how!
Quick Thoughts about Synthetic Runtime Tests
Using models of various cells (or even batteries), it’s possible to test the duration of most modes a flashlight offers. This requires an accurate characterization of a cell, including how it responds at certain currents, typical internal resistance, and the total cell capacity. Using a 4-wire measurement, the current of a mode (in amps) and lux (or lumens) output at a certain voltage can be logged. Once logged, this log can be combined magically (mathematically) to produce a “synthetic runtime” and then graphed accordingly.
Disclaimer:
- Much of the work here is not mine — certainly, none of the brainy part is mine. I’m just the hands. Full credit to Parametrek with quotes and links where relevant.
- Presenting this post this way both catalogs it (for me, since I know I’ll forget how to perform this) and also asks you how valuable you find the information. (More on that second one later!)
- It does take less time than any runtime, but it’s still a lot of effort.
- Despite synthetic tests offering tons of possibilities, I only aim to scratch the surface, and if this is pursued, only do the simplest type of synthetic tests. (More on that later).
- Maybe you’d be more interested in MultiLux.
A sideline point of this whole thought exercise is something I’ve included in reviews for years now – the “Modes and Currents” table. A certain mode uses a certain amount of current, and from that information, you can estimate how long the light might last on that mode with that cell. This synthetic runtime test process is a very big expansion of that idea.
Less Quick Thoughts
Synthetic Runtime Test Overview
After I completed this DIY bench power supply, I realized it’d be neat to use it to power lights throughout a runtime test. I called this “perfect power.” Using a bench power supply as a perfect power source would mean I no longer had to worry about cell age, internal resistance, or other possibilities. (Like “fake” cells!) I would be able to trust that the runtime represented the output of a flashlight in the best light.
Later, during a conversation with one of the most approachable, very smart people I know, I mentioned “perfect power.” (You can tell the alliteration appeals to me!) Little did I know, Parametrek was already onto this and there was a name for it, too! Synthetic runtime testing! It was better than what I’d imagined. Not only could the bench power supply be used for perfect power (quote unquote), but tests for even the longest modes could be completed very quickly!
An overview of the synthetic runtime tests is as follows: Connect a flashlight to power with a bunch of wires. Turn the bench power on and set it such that the flashlight itself sees a “full battery” (for example, 4.2V). Turn on the flashlight to a lower mode (that wouldn’t be expected to be affected by temperature). Record current, voltage, and lux. Drop the bench power by whatever you are comfortable with (for example, 0.1A or 0.05A) and record those same three values. Do this down to when the light either shuts off or has very low output (say, 1% of its initial). This information will be fed into a Python script with whatever parameters you set, and the Python script will output a synthetic runtime in .csv format. Graph this and boom, synthetic runtime test!
Again, I want to state that despite thinking of “Perfect Power” on my own, I in no way came up with any of this strategy – this is all the work of Parametrek! Full credit goes to Parametrek!
Parts List
I didn’t take any photos for this section, but my parts look exactly like Parametrek’s. I even used orange filament! This is only the hard goods. You’ll need graphing software and a mouse, and stuff I’m not about to try to mention.
- Bench power supply
- Digital multimeters (2)
- Lux meter
- A bunch of wires
- The 3D printed jig (just going to say it’s officially required. You don’t have enough hands to do this otherwise.)
Here are all the parts for the jig:

Here’s the top view!

You put the lime in the coconut (the spring goes between the two printed parts, like so):

The spring gives a bit of flexibility so that all the electric parts can maintain a connection. This is very important!

Here are the jig parts all assembled. I added some heat shrink so I wouldn’t have to think about which wires are which connection. Red is positive and black is negative.
The jig “provides a tidy and stable means of performing measurements with a 4-wire Kelvin connection.” And that’s so true. I’ve used the jig just for general testing of things that aren’t even related to synthetic runtime tests, too!
Regarding the jig:
This was created with a 3D printer. The wire is common 12 gauge house wiring. The spring is from a cheap ballpoint pen. You can of course improvise with what you’ve got. I went with 3D printing because it is easy to tweak the variables in the SCAD file to produce a jig for 16340/18650/21700/etc lights.
I honestly had less luck scaling this up to 18650, though my jig technically does work. I’d welcome a more professional designer to make the other sizes (in stl format)!
You can download Parametrek’s jig in .stl format here. In case hotlinking doesn’t work, it’s also in the post.
Connect The Things
Ultimately, the connection is as follows:
- Connect your bench power supply to the flashlight
- Connect one DMM for voltage readings
- Connect another DMM for current readings
- Set up your lux meter near the flashlight’s output
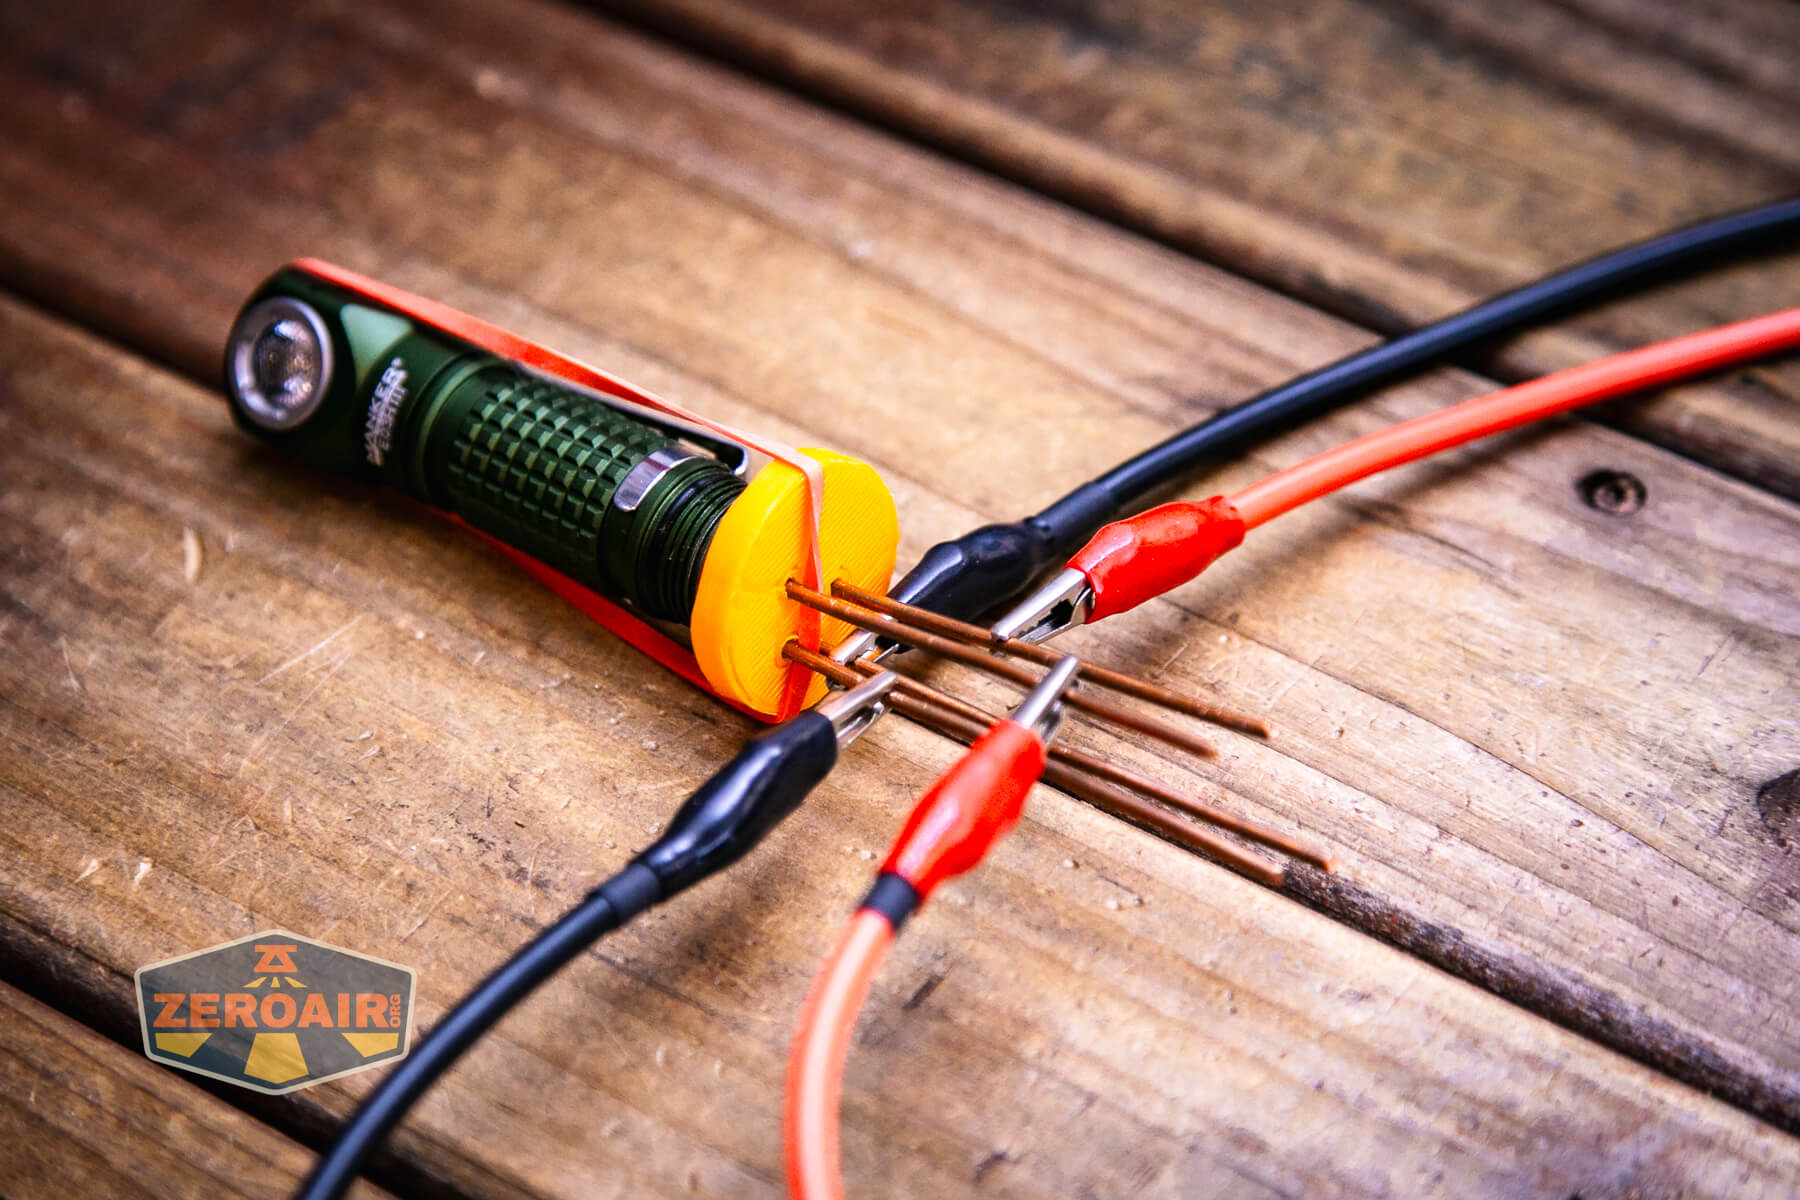
You really have to understand the 4-wire readings Parametrek talked about above. I put my current-reading DMM between the power supply and red wire (in series, I believe). The voltage-reading DMM is connected to red and black.
Yes, technically, the bench power supply displays both the voltage and current! But using this 4-wire setup is more accurate!
Collect the Data
This is mostly covered above, but you’ll need to use both DMMs and the lux meter to collect three bits of data, then save them as a .csv. Here’s an example from the light I’ve tested below.
volts,amps,lumens
1.605,0.1399,983
1.501,0.1505,983
1.396,0.163,983
1.3,0.1748,982
1.192,0.1905,982
1.085,0.2096,982
0.987,0.2299,982
0.876,0.2584,980
0.753,0.3033,980
0.652,0.3568,980
0.525,0.4676,980
0.529,0,0
I don’t really expect you to perform these tests, so I will only cover this briefly. The last column of “lumens” (for me) is really “lux” and I manage that in my Excel spreadsheet anyway.
The Skilhunt H150 is either the very best or one of the worst lights for synthetic runtime tests. It might be the best because we can see exactly the duration of a synthetic Panasonic Eneloop vs a genuine, in-the-flesh brand brand-new Panasonic Eneloop. A separate test with the other type of driver, where the output is exactly related to voltage, would be a good comparison, too.
Process the Data
After you’ve saved your (probably) handwritten data (if you can read it) as a .csv, you’ll want to feed that into the Parametrek Python script. The script has a helpfile (and ChatGPT tells me it’s an extraordinarily well-written script), but ultimately, you’ll end up typing something like this in the terminal or command prompt:
python3 synthetic_runtime.py -c eneloop-aa -f seconds,lumens,volts --resolution 2 --logging 2 skilhunt_h150_m1_eneloop.csv skilhunt_h150_m1_eneloop_results.csv
I tried processing the data with something like “seconds,lux” and either I didn’t do it right or it’s not set up that way. From –fields list, the available fields are:
seconds minutes hours days lumens volts amps Ah ir lum/W lum/W_sys W_load W_bat
But no “lux.” Not that it matters; I can still work with that data!
As you can see from the command line, the output file (which is “a runtime log”) will be named in the text. In this case, it’s called “skilhunt_h150_m1_eneloop_results.csv”. Naming it something short would certainly be easier.
Graph the Data!
Now you take the generated (synthetic) data, which looks like this:
hours,lumens
0.0,269.0
0.016666666666666666,269.0
0.03333333333333333,269.0
0.05,268.99999999999994
0.06666666666666667,269.0
0.08333333333333333,269.0
0.1,269.0
And drop it into your graphing software and graph as usual!
Skilhunt H150 (Grey, 3000K)
I was interested in testing how a mathematical model of a cell and a bunch of data points from a flashlight combined in a runtime. So I tested it on this Skilhunt H150. This is the grey mode, a 3000K high CRI version.
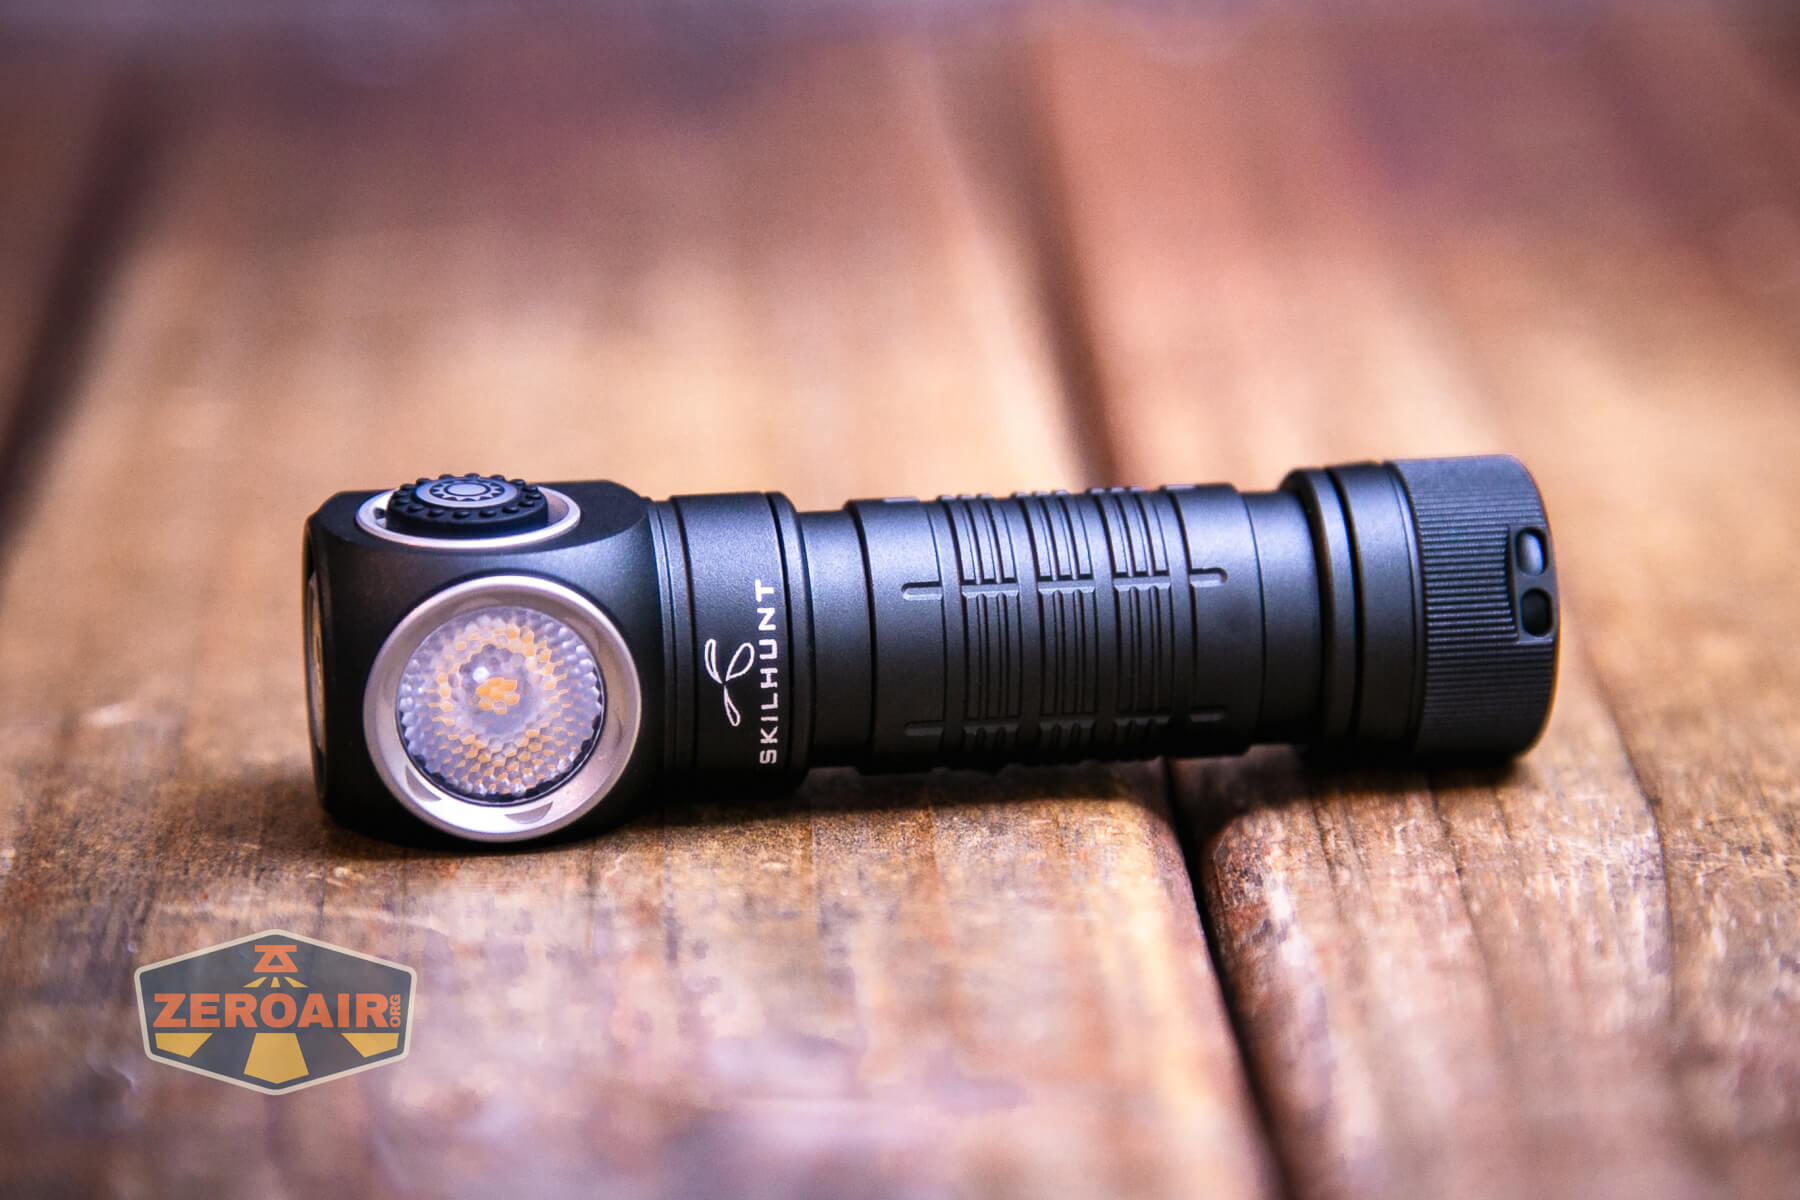
Then I thought, what good is a mathematical model when there’s no comparison? So I bought four brand new Panasonic Eneloop NiMH AA batteries and tested these two long modes, too!
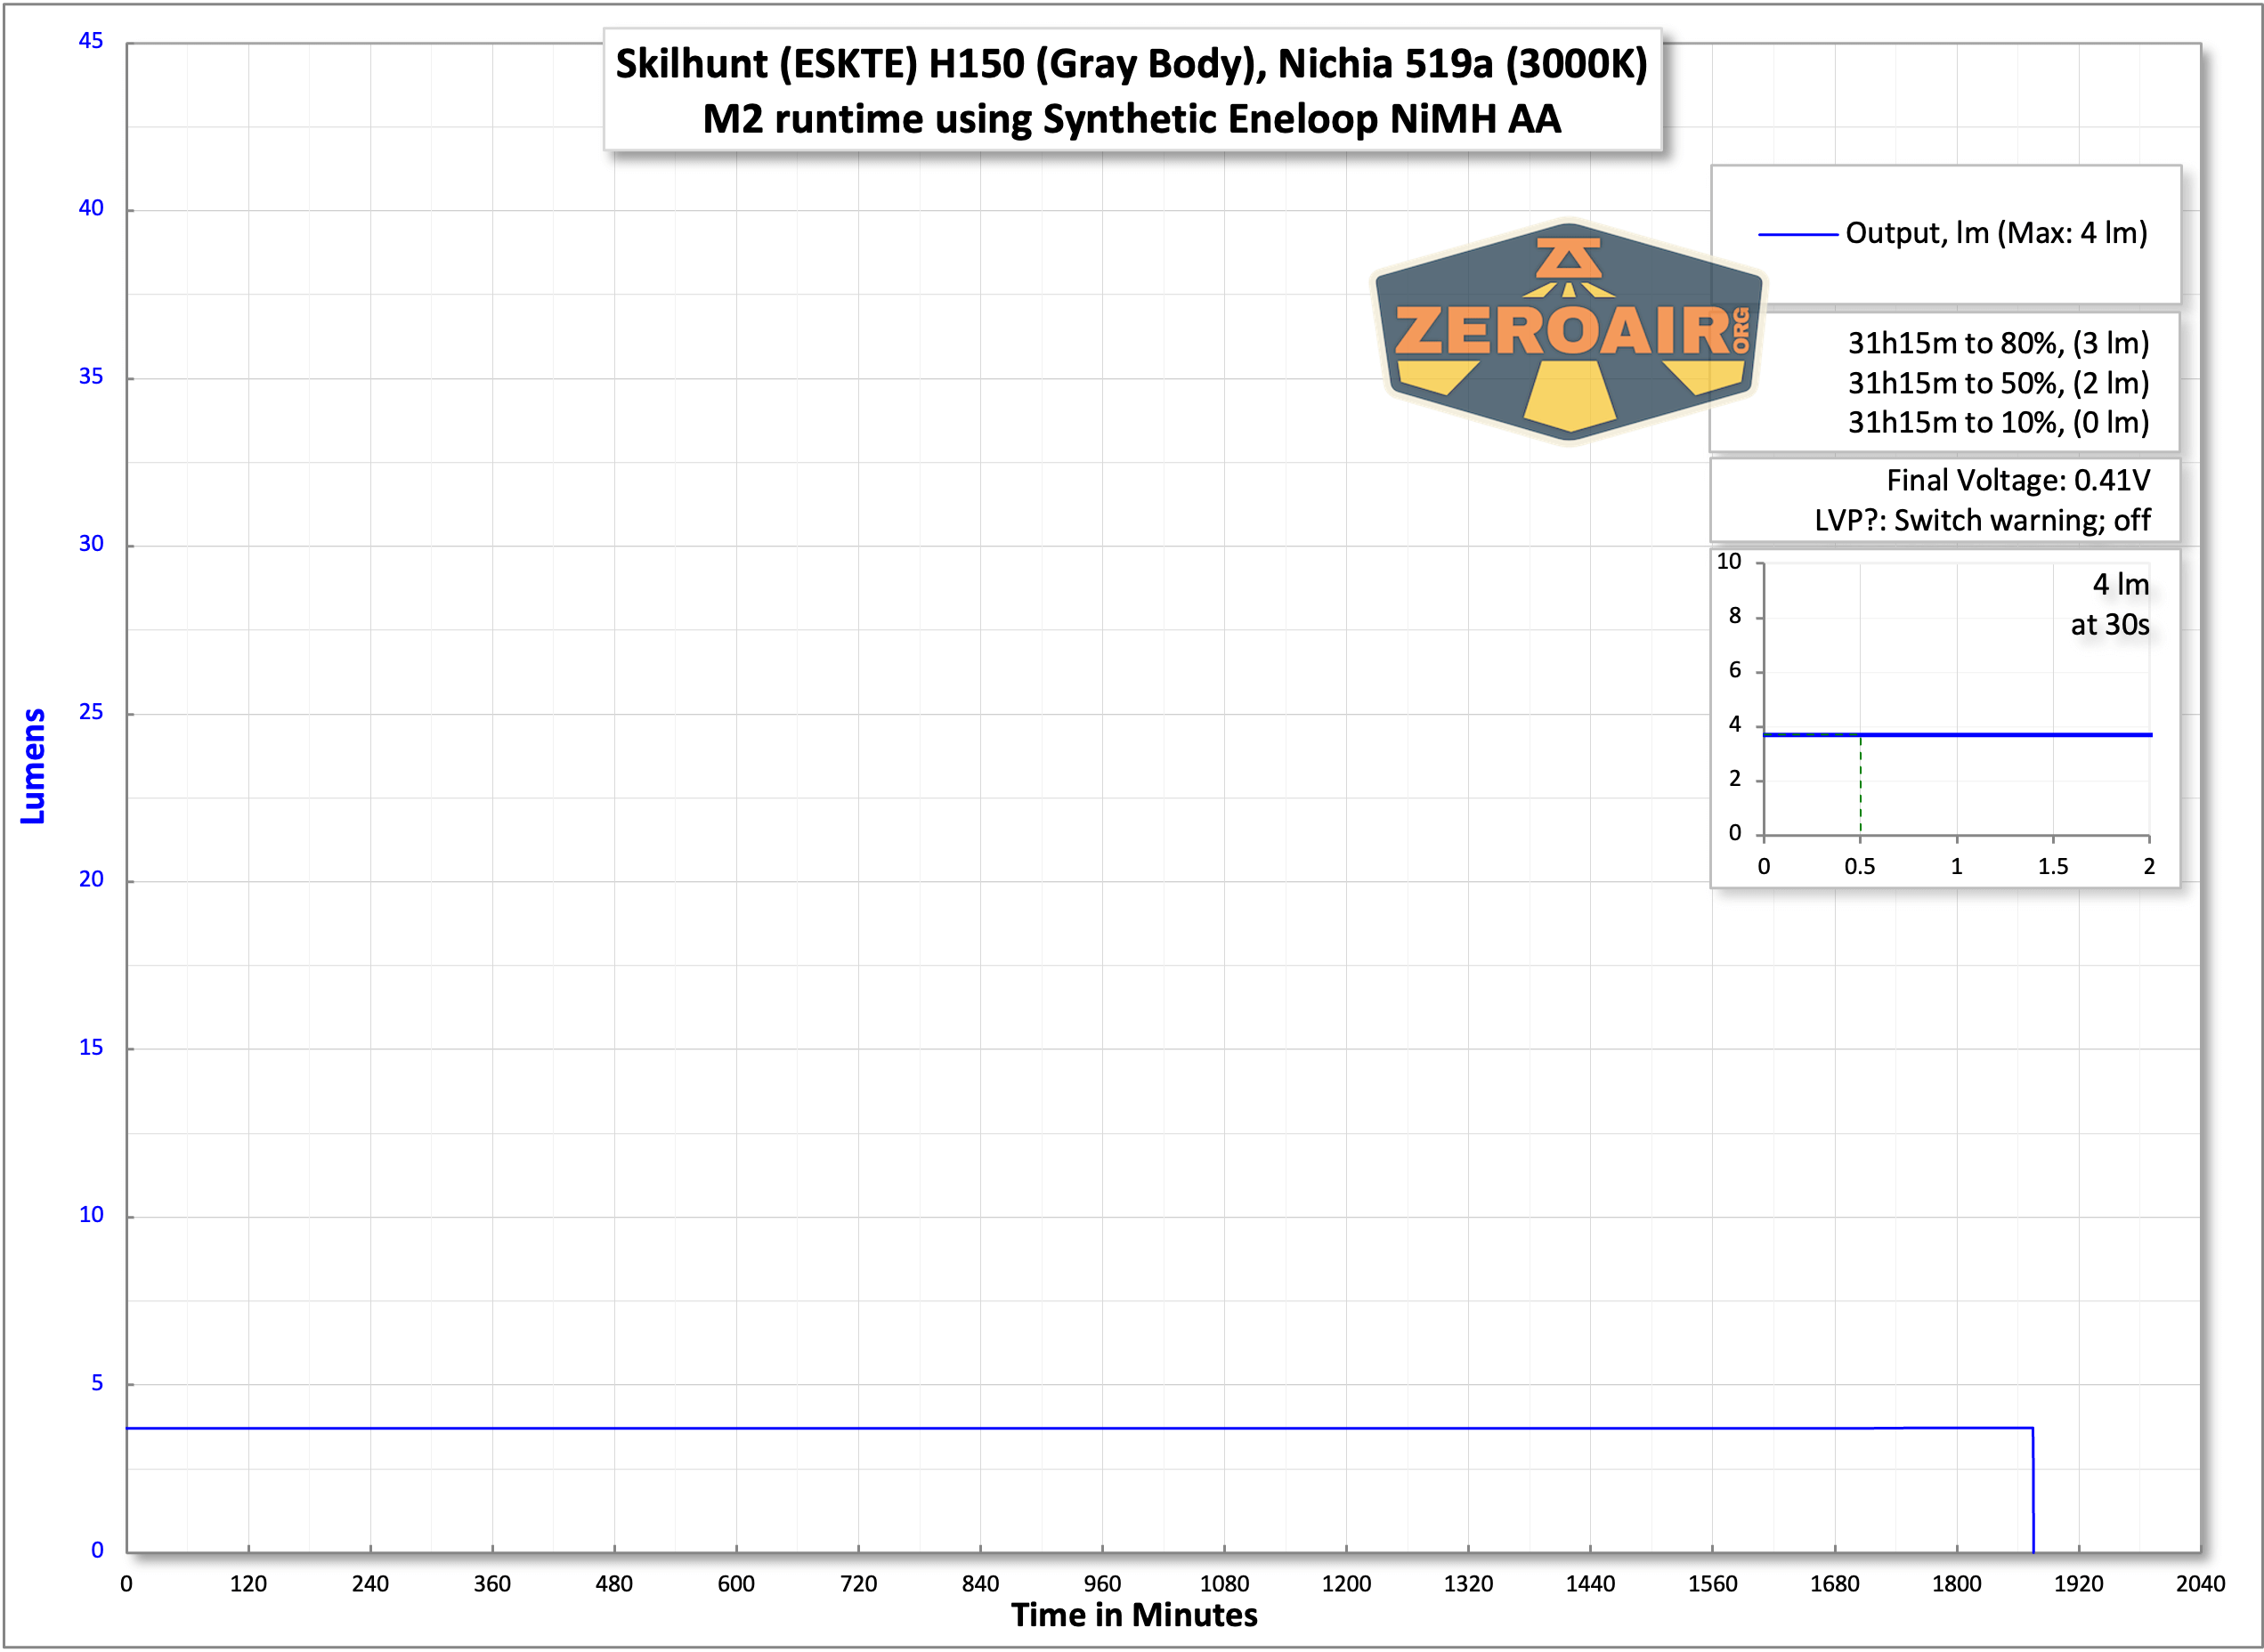
Here are graphs for modes M1 and M2 for the Skilhunt H150. The claim for these two modes is longish. 14 hours and 49 hours for a NiMH cell.
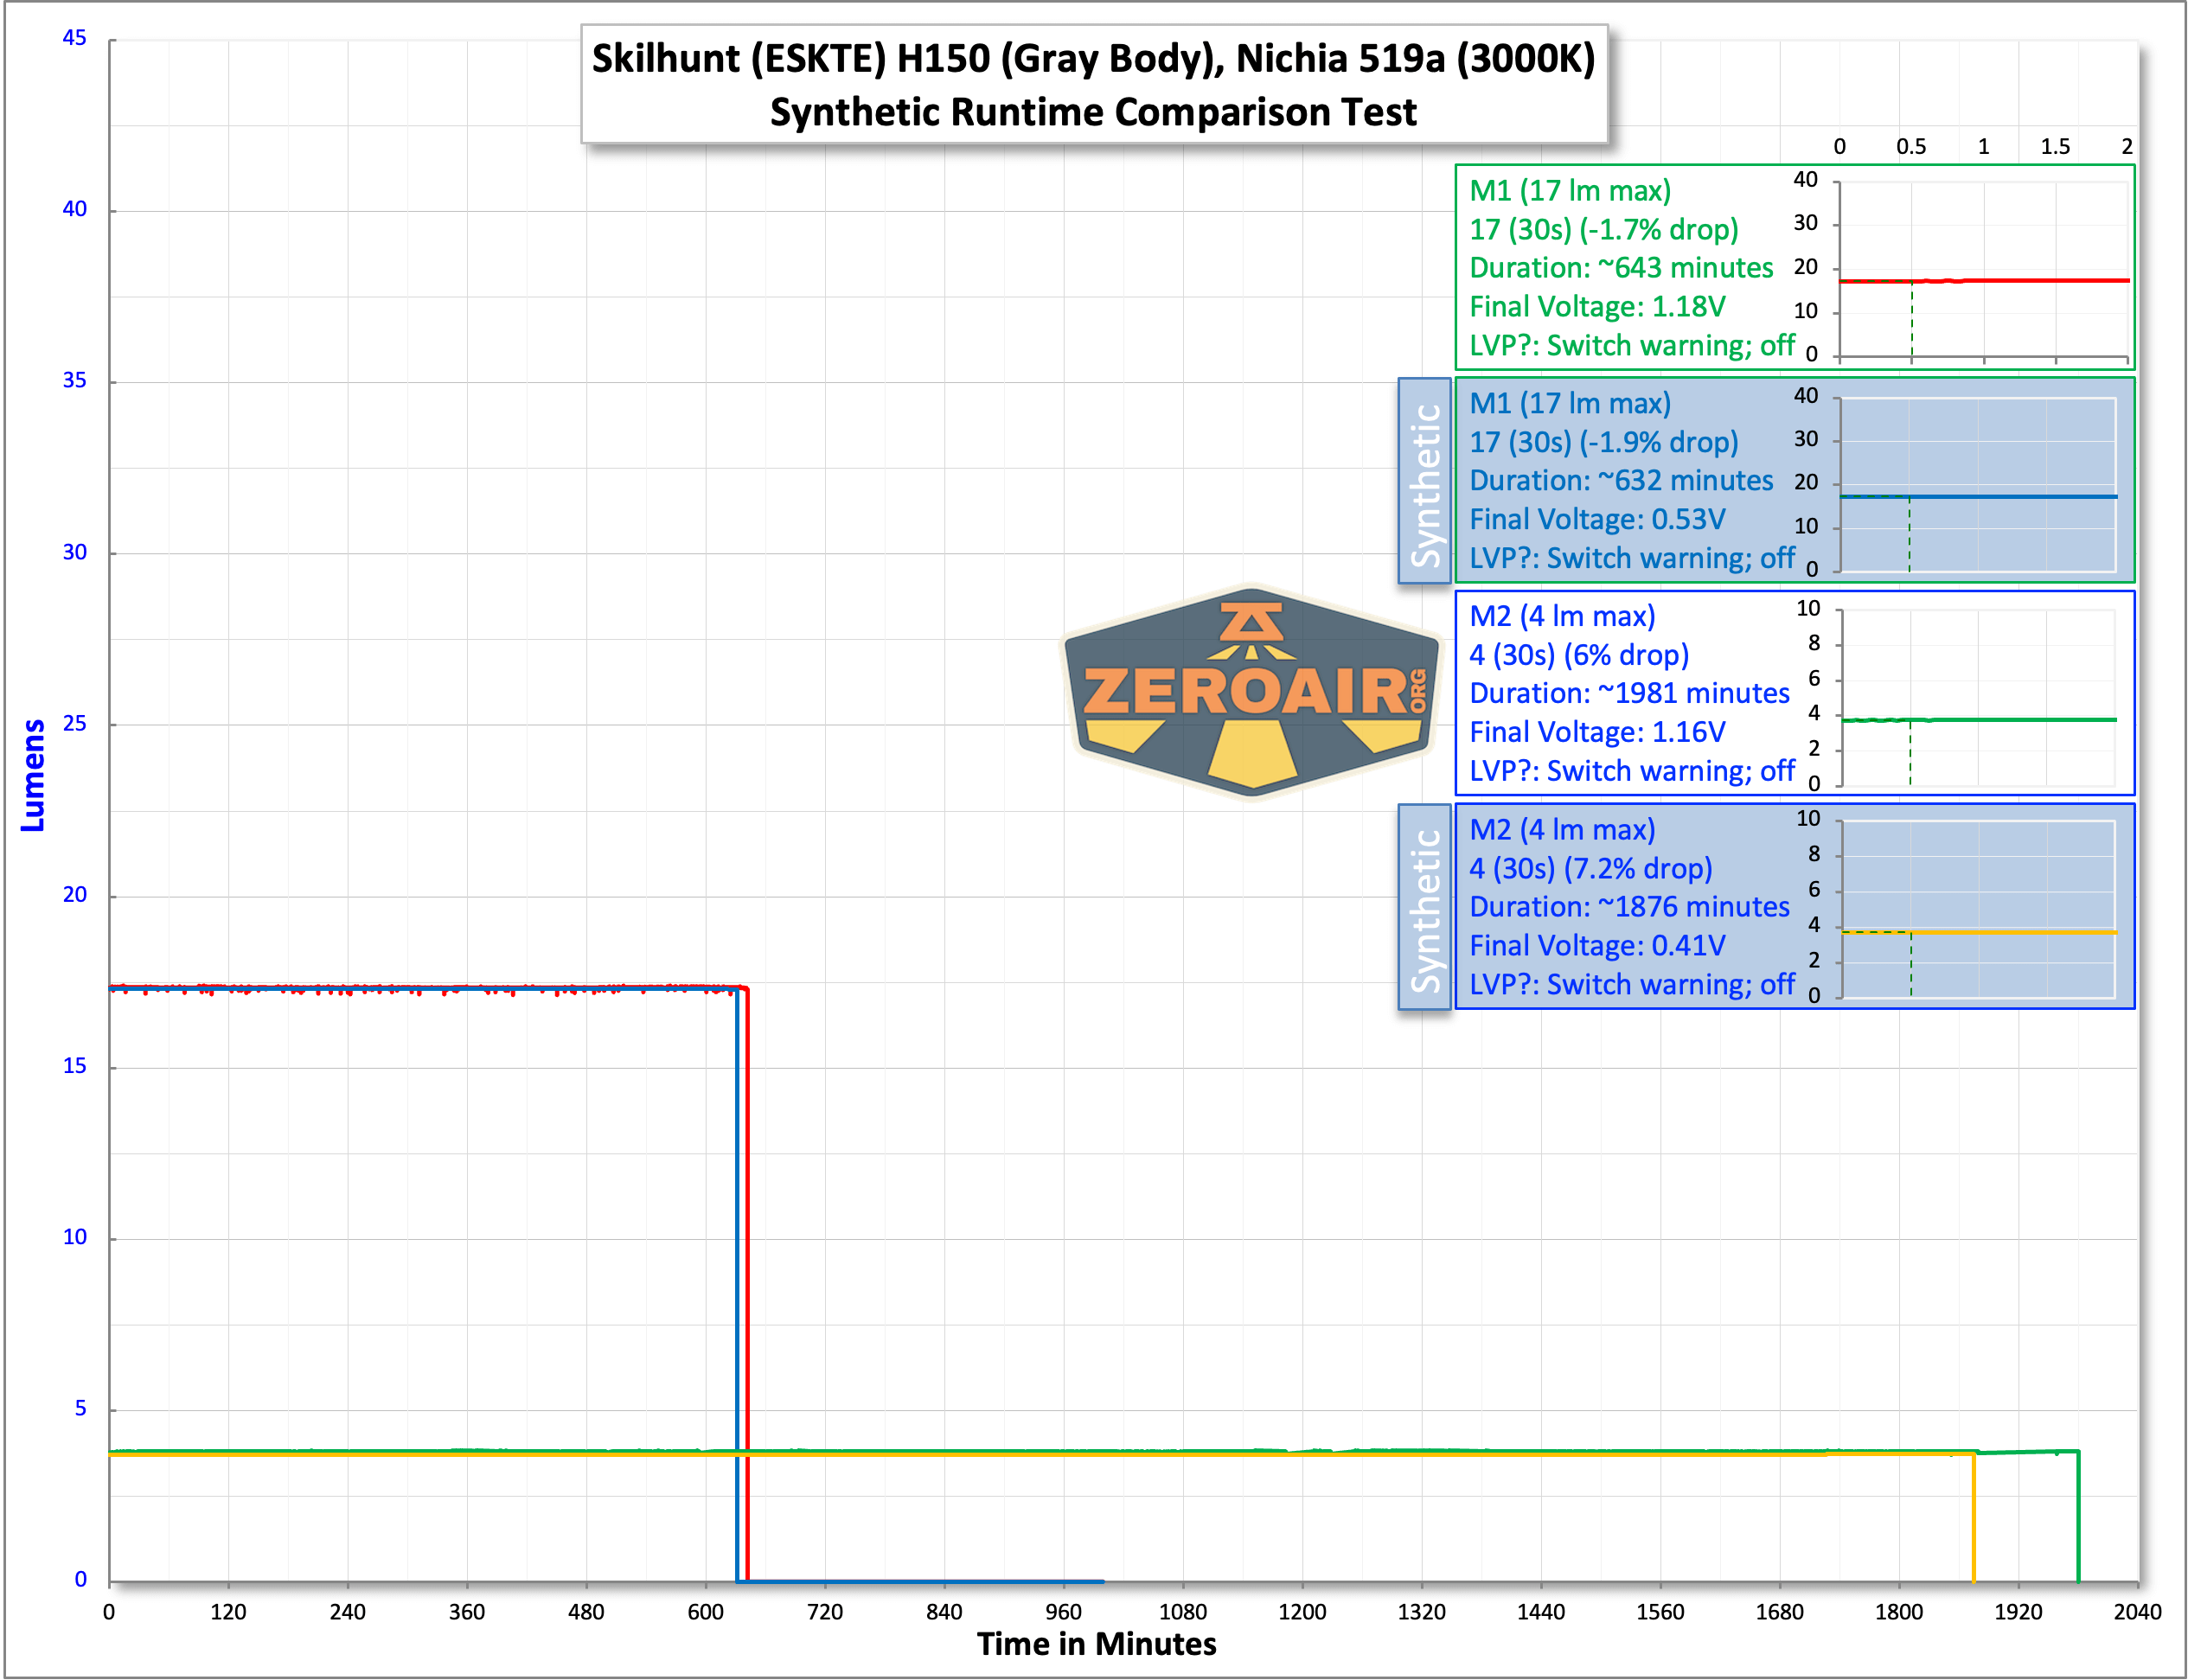
There’s the “big picture” comparison. The whole point there is the duration (do not get hung up on the output). In the review linked above, I tested M1 as “17 lumens” and M2 as 3.5 lumens (for 1.5V input). That means they are 17 and 3.5 lumens for any power source.
The graph above provides some answers about synthetic runtime tests vs full-duration, physical cell tests. There’s a bit of a difference in duration. For M1, the physical cell lasts 1.73% longer. For M2, the physical cell lasts 5.44% longer. In both cases, the physical cell lasts longer, and that seems to scale just a bit (around 3%, the longer the test lasts and the lower the output is (maybe).
I say that just to say that synthetic runtime tests are “probably good enough” of an estimate!
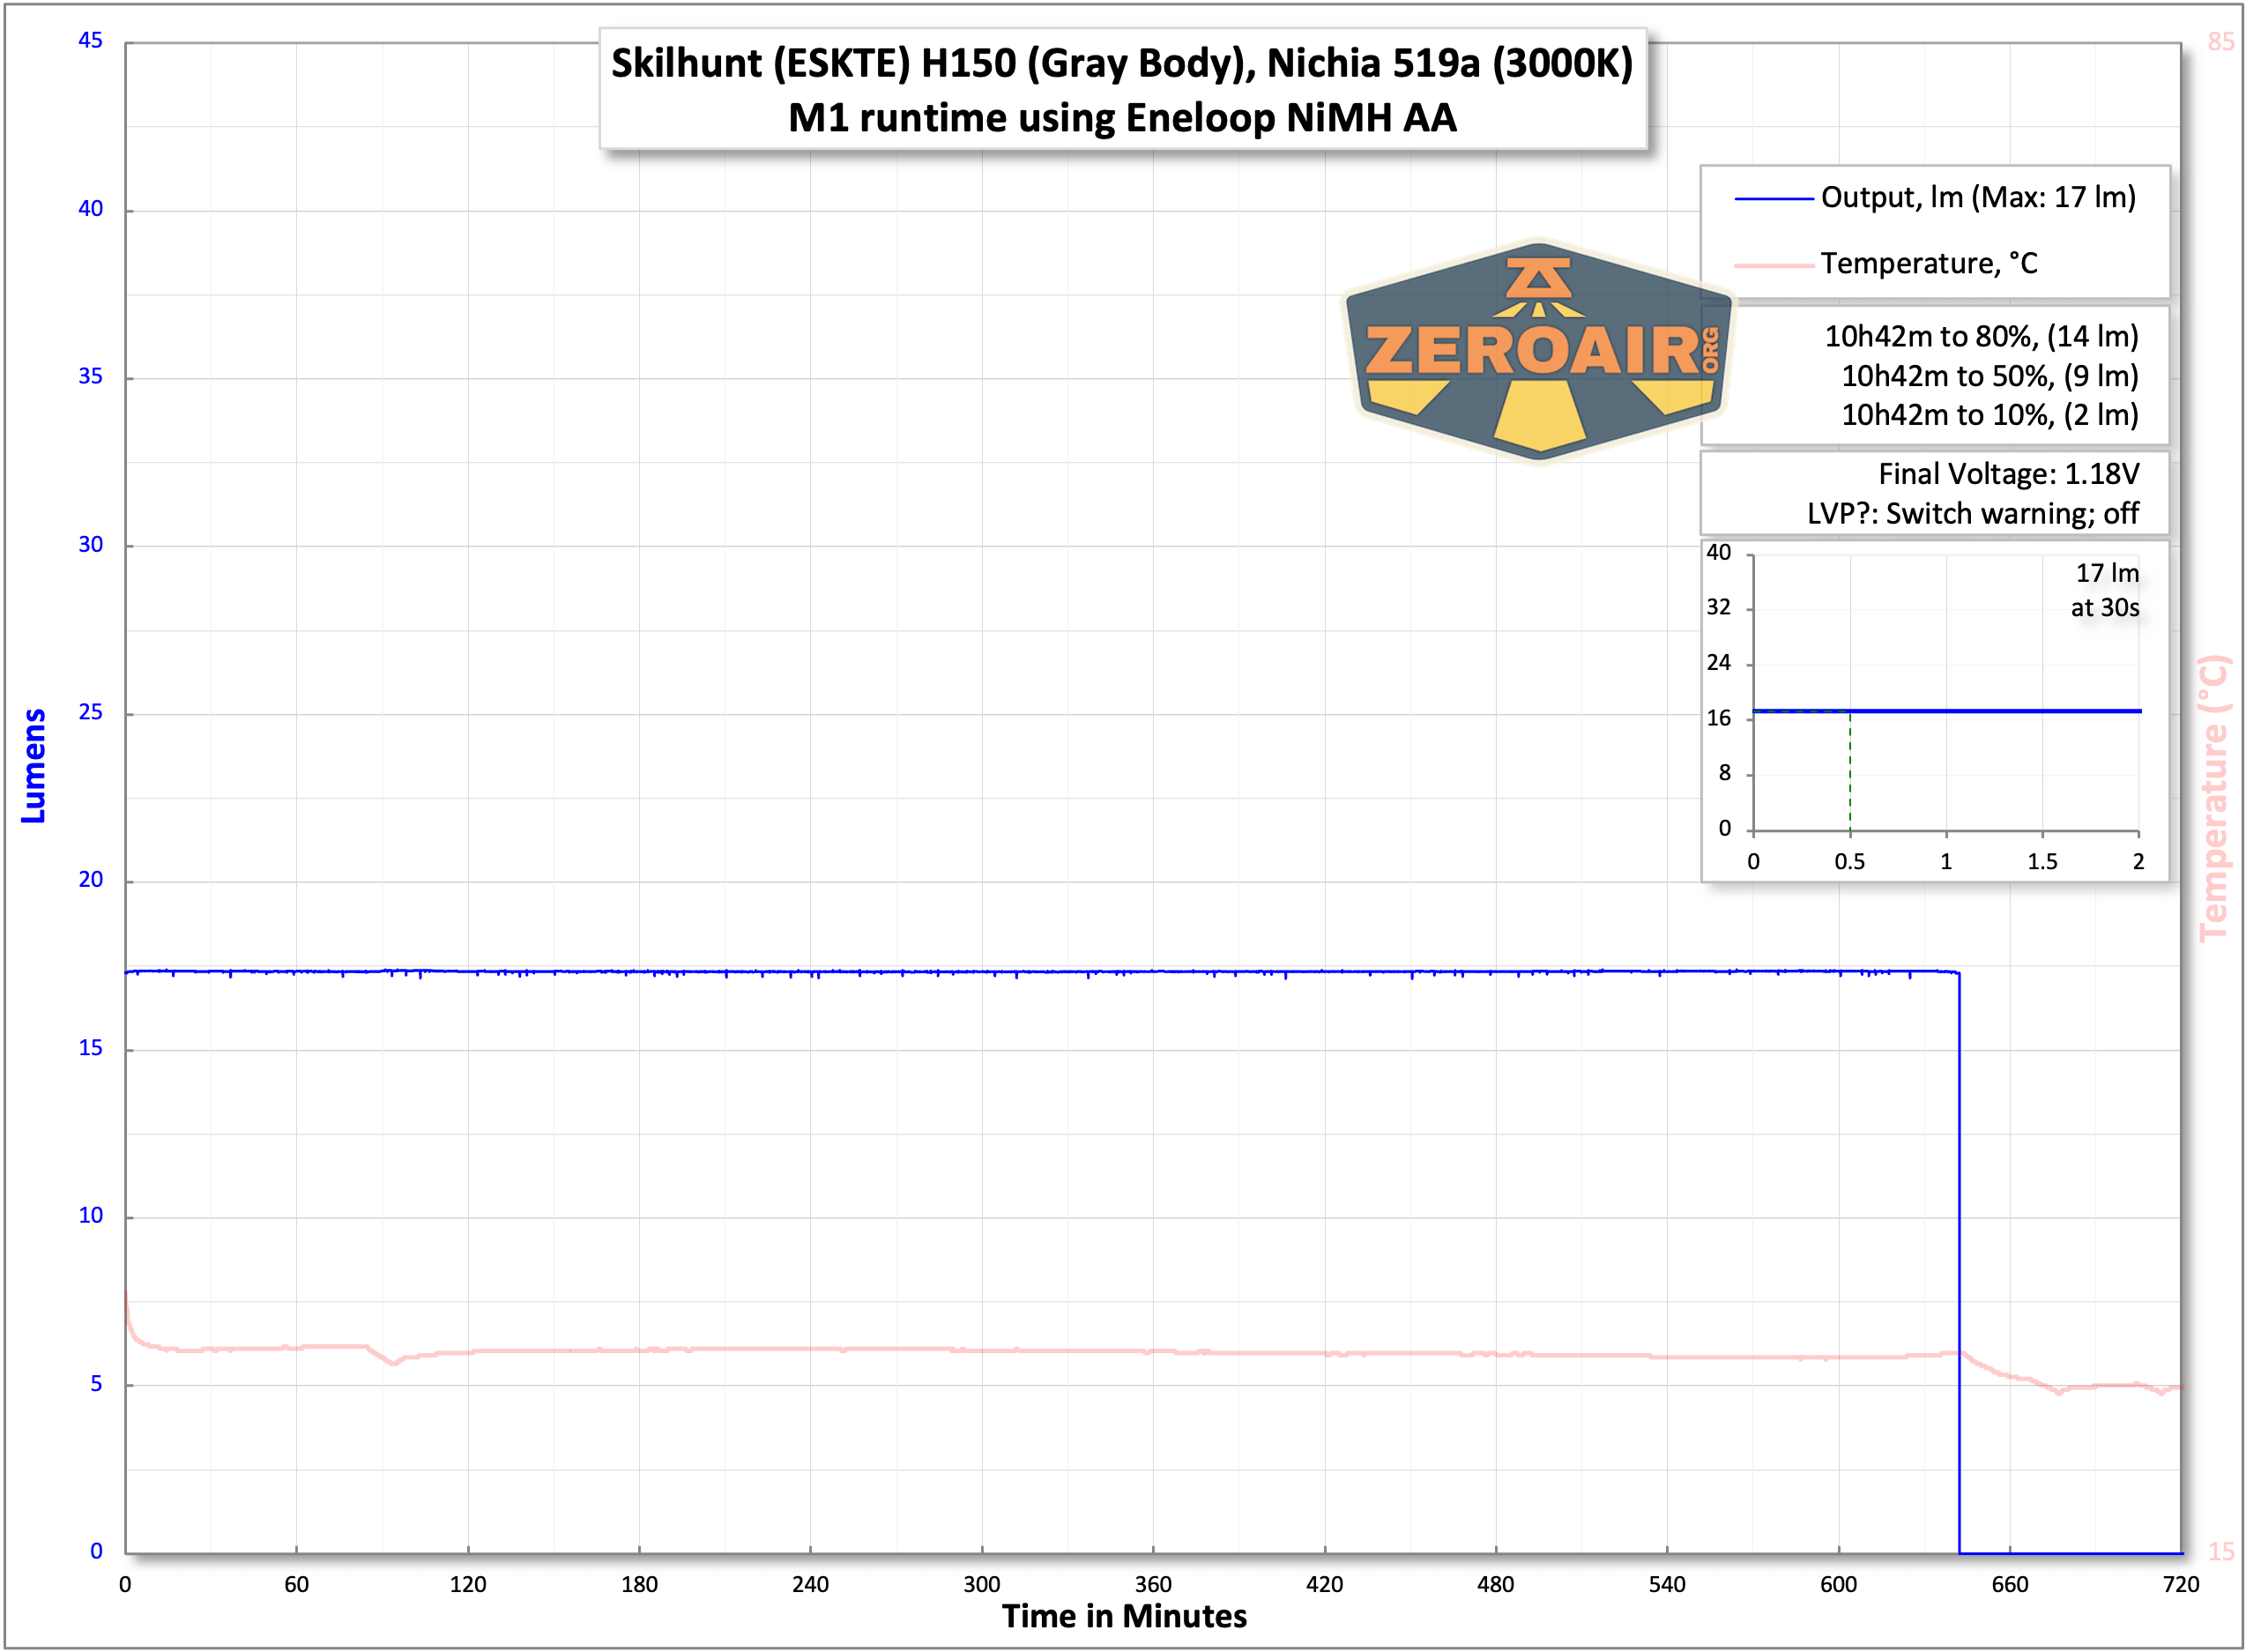
Skilhunt’s claim for M1 is based on a 2450mAh NiMH (1.5V) cell. Eneloops are lower than that (1900mAh, I believe). This suspicion is borne out by the .json file, again, thanks to Parametrek, which uses a capacity of 1.9Ah for the synthetic runtime tests.
Thus, Skilhunt’s claim is based on something we aren’t even testing here anyway. 2450mAh vs 1900mAh is a considerable difference. Skilhunt claims M1 will last 14 hours with its 2450mAh NiMH. The math actually bears this out – 2450/1900 = 1.2895. 10.5 (hours, the tested runtime)*1.2389 = 13.54 hours. So, in this case, we could generally say that Skilhunt’s claim is probably accurate.

One thing it’s nice to note that you can see in the test below (and the “real” one higher up, too) is that temperature does not play a role in either of these two tested modes.

We can apply the same math as above to this test. Skilhunt claims 49 hours for M2. In this case, the math (from this runtime duration of 31.25 hours) suggests we would only expect ~41 hours on this mode with a 2450mAh NiMH.
Another interesting test (unrelated to synthetic runtime tests) would be to use this same “brand new” Eneloop and perform the same runtime 10 times to see if or how the duration degrades over time.
Wiggles
There are some scenarios where I’m unclear what is the right information from synthetic testing. For example, when a light steps down enough that the voltage “recovers” a bit – how do I account for that? This happens mostly (or only) on lower modes, for which synthetic tests aren’t ideal anyway. I suppose all that would happen is that the runtime will be longer because the cell has “recovered” a bit.
Another thing I don’t love about the synthetic tests is that there’s no way to capture any thermal data. I don’t strictly mind that it’s not there, I just dislike the consistency between those graphs with temperature and those without.
Is it worth it?
Now, is it worth it? Well, worth what? It’s certainly a fun use of Python scripts and math by Parametrek to even make something like this a reality. It’s better than the perfect power scenario I had in mind years ago.
Ultimately, this testing is for just one specific thing (in this case, a 1900mAh Eneloop). And even in this case, the manufacturer used a different capacity NiMH cell (2450mAh). On the surface (just the graphs), it’s confusing. With a bunch of words to explain it, it’s probably not going to be consumed and/or digested.
Is the information useful to you? Having been presented with these graphs, do you look at the claim and what the graph shows, and say “Skilhunt overestimated claims” (without considering the capacity of the cell used?) Or would you say “Those tests are just mathematical models, so that’s not the real world?
I’d also need to rely on others for accurate models of cells, such as a standard 14500, 21700, etc. I picked the Skilhunt H150 because it’s interesting and because the Eneloop model is already available.
I enjoy providing data and using Excel, but adding synthetic runtime tests might end up being more problematic for users – for example, it’s unlikely that I would disassemble “sealed” lights just for synthetic runtime tests. That leads to frustrating differences between posts (ie, not the standard “three runtimes” for every post.)
To further this “possibilities point”: If there were a model for this 1900mAh Eneloop as well as a model for a 2450mAh NiMH, such as Skilhunt tested with, it seems prudent to Python both of those “cells” and graph those. The graphs (and graphing effort) could start stealing chunks of time! I could provide .csv data without graphing, but my reviews have not historically been “DIY” reviews.
Conclusion
First, the whole synthetic runtime test scenario is a marvel of data and programming, and I’m pleased to have been able to figure out how to use Python enough to make actual data from it! I love the idea and I’m even sold on the results (certainly after comparing a real cell to a synthetic cell!) It’s great (incredible, really) that such tests for 14-hour and 49-hour runtimes can be completed in minutes!
However, synthetic runtime tests are a lot of effort. It’s not just data collection, but it’s troubleshooting each individual file and then graphing it in a non-standard and (potentially) system-intensive way. And explaining it! Now I hope I can reference this post to explain it!
In any case, I hope you enjoyed this foray into testing mathematical models of runtimes and comparisons to logged runtimes.
One thing to note is that if I do begin incorporating synthetic runtime tests into standard reviews, I’ll make sure it’s abundantly clear that the test is synthetic. Much like can be seen in the group runtime above, but probably even more obvious!
Questions
Let’s hear all those questions in the comments, or by email!
Sources
https://redd.it/qgz6vh
https://redd.it/qr6ltn
Notes
- This is not a sponsored post. The light used in this test was sent for review and completed in a different post.
- This content originally appeared at zeroair.org. Please visit there for the best experience!
- Use my amazon.com referral link if you’re willing to help support making more reviews like this one!
- Please support me on Patreon! I deeply appreciate your support!
Discover more from ZeroAir Reviews
Subscribe to get the latest posts sent to your email.
Sounds promising. I thought this Paramatrek project was going to remain theoretical. I’m excited to see developments today.